Analysis and results
Milliman’s analysis projected net biologic spending from 2021 to 2025. This projection was performed separately by market based on historical utilization and cost information for biologic and biosimilar drugs. Milliman estimated cost and utilization by biologic drug over the next 5 years based on assumed biologic patent and market exclusivity expiration dates and biosimilar availability. Net biologic spending was allocated by stakeholder using various actuarial cost models by market.
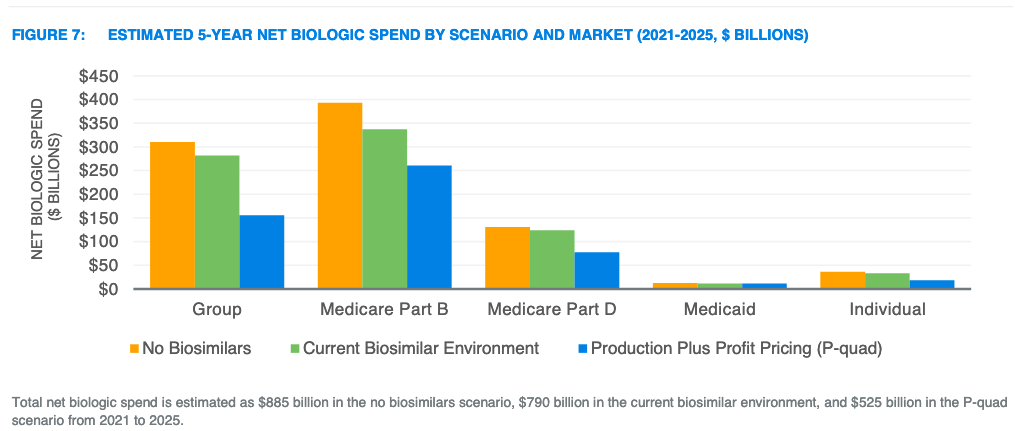
This projection considered the major sources of healthcare financing for biologic drugs in the US: Group insurance (i.e., employer-sponsored health insurance), Medicare Part B, Medicare Part D, Medicaid, and on-exchange individual markets. Insurance coverage through the off-exchange individual market, TRICARE and other veteran benefit programs, and other private health coverage were excluded.
Three separate projection scenarios were considered:
- No biosimilars: As if no biosimilar competition existed and biologic prices were not regulated.
- Current biosimilar environment: The status quo where biosimilars can compete with biologics after their patent expires.
- Production plus Profit Pricing (P-quad): Biologic prices are set based on production costs after 12 years of exclusivity, and biosimilar prices are set based on production costs upon market entry. No adjustments are made for the advance research and development costs prior to production.
Figure 7 from the Milliman report illustrates the estimated 5-year net biologic spending by scenario and market. Milliman estimates savings in this report as the reduction in net biologic spend for each scenario relative to the “No Biosimilars” scenario. Total savings are split among member cost sharing, premiums, government subsidies, and other offsets. All values are estimated net of rebates.
Key drivers of incremental savings
- Greater savings for products with biosimilars. In the current biosimilar environment, the assumed biosimilar unit cost savings were 30% and expected market share was 30%, on average, after 24 months. In the P-quad scenario, a 65% net price decrease was assumed and applied to 100% of utilization. An estimated $55 billion in incremental federal savings could be realized by setting production-based prices for biologics facing or expecting to face biosimilar competition by 2025 relative to expected savings from biosimilar competition.
- Savings for products without biosimilars. Currently, about 49% of biologic spending is for products without a biosimilar in development. The P-quad proposal is estimated to produce $40 billion in incremental federal savings for biologics that are not expected to face biosimilar competition by 2025.
This Milliman analysis estimates net biologic spending under three different scenarios (no biosimilars, status quo, and P-quad) separately by healthcare market (e.g., group insurance, Medicare Parts B/D, Medicaid, and on-exchange individual) and stakeholder (e.g., plan sponsor, federal government, beneficiaries). This Milliman report should be read in its entirety to understand the assumptions, limitations, and findings. Notably, Milliman assumed P-quad prices would be passed through to beneficiaries. Savings could be less than estimated if other stakeholders, such as providers, PBMs, wholesalers, and pharmacies were to retain a greater portion of the P-quad price changes. In the baseline, Milliman assumed there would be no stakeholder behavior changes. In sensitivity analyses, Milliman did explore the impact on net biologic spending of potential behavior changes.
More details on the premium impact by market, stakeholder considerations, assumptions and methodology, and limitations can be found here.