Issue Area

Supply Chain Economics Favor Higher Cost Drugs

Stakeholders throughout the supply chain benefit when the list price of a drug is high

The structure of the US pricing and reimbursement system, and its reliance on manufacturer rebates, play an important role in keeping drug prices high. As the drug passes through the supply chain, each stakeholder has the opportunity to receive discounts before selling at a small profit to the next party, then charging the payer and PBM the list price plus administration, dispensing, markup, and other miscellaneous fees. To mitigate the high cost of reimbursement, payers and PBMs depend on manufacturer rebates to offset much of their spending.

Despite the introduction of lower-cost authorized generics and biosimilars in large categories such as diabetes, immunology, and cancer, there has been a surprisingly muted effect on costs to patients and the health system. The sizable rebates payers and PBMs receive incentivize them to prefer branded products. For an authorized generics or biosimilar to compete, they would need to price much lower than the net price of its branded competitors.

In the buy-and-bill market, providers are reimbursed by Medicare on the basis of ASP, or average selling price. Since both the buy-sell spread and the administration fees are calculated on the basis of list price, there is a not-so-subtle incentive for providers to favor more expensive treatment options. This is exacerbated within the 340B market, in which the statutory discount provided by manufacturers further widens the spread between these hospitals’ and clinics’ acquisition and reimbursement price.

What is at stake?
25%

The average gross-to-net spread for the 20 top-selling drugs in the US is 25%, with the four largest drugs exceeding 50% discounts.

43%

The average gross-to-net spread for the top 15 companies by revenue is 43%, with the difference reflecting the portion of revenues captured by payers (including government), PBMs, pharmacies, and distributors.

Payers routinely receive rebates for drugs, but patients’ out-of-pocket costs remain high

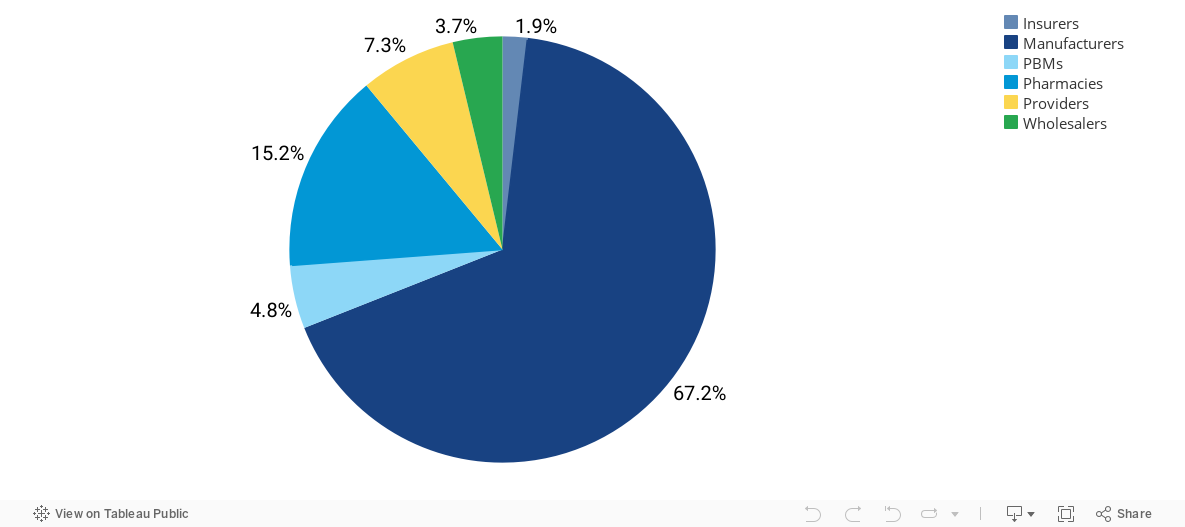
The differential between gross and net revenues reached $187 billion in 2020, with approximately two-thirds of this amount comprised of rebates to third-party payers.1  Rebates are so important to the payer and profits from spread pricing so lucrative for providers that there is strong systemic resistance to recent efforts at reform. Rebates have moved up steadily as a result of the high concentration and market power exerted by the top three PBMs, which process over 75% of all prescription claims.

The entrenched system through which pharmaceutical companies rebate a significant percentage of the reimbursed drug price back to the payer is a structural problem that leads to host of inefficiencies and distorted incentives throughout the supply chain. Payers and PBMs claim rebates keep premiums low. However, recent calls for pricing transparency have led companies to disclose the magnitude of these discounts, underscoring that PBMs and other supply chain intermediaries play an important role in pushing up patients’ drug costs.

Unfortunately, patients, including Part D beneficiaries, typically do not share in these large rebates and steep discounts to the list prices. Coinsurance and cost-sharing in commercial and Part D plans are based on percentages of the pharmacy prices that generally exclude rebates. Since progression through the phases of Medicare Part D is also determined on the basis of these negotiated prices, beneficiaries reach the catastrophic phase more quickly, which also results in higher cost-sharing.

  • The average discount for drugs across manufacturers’ portfolios ranged from 45.5% to 50% in 2020, with the difference reflecting the portion of revenues captured by payers (including the government), PBMs, pharmacies and distributors.
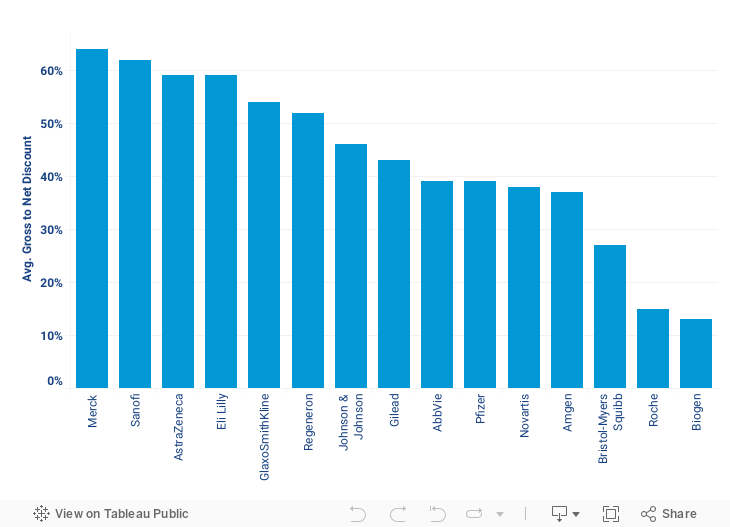
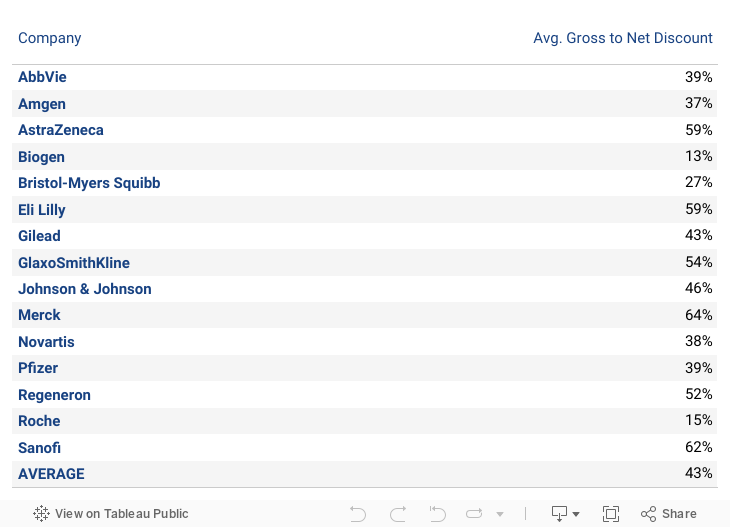
  • The average gross-to-net spread for the top 15 companies was 43% in 2019. Although rebates remain the largest component, 340B discounts are a growing factor for certain companies. For example, Merck, Lilly, and Sanofi are near the top due to dominance of diabetes drugs in their portfolios.
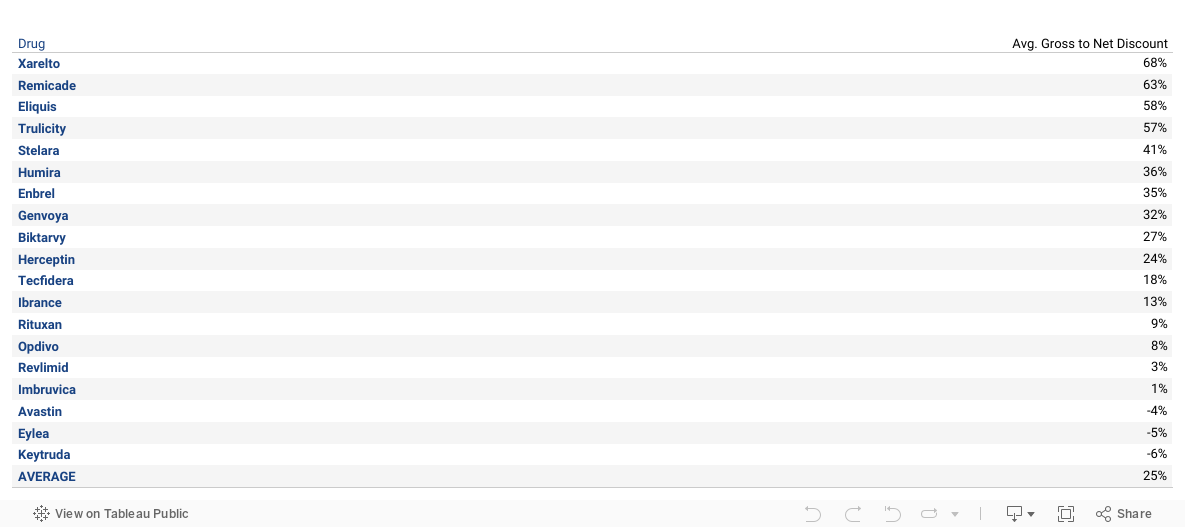
  • The differential between the WAC and net price for the 20 largest drugs is 25%, with the 4 largest drugs exceeding 50% discounts.

To see how rebates work within the supply chain, visit our Pricing Tutorials page.

50%

The average discount for drugs ranged from 45.5% to 50%.

43%

The average spread between list and net prices for the top 15 companies by revenue is 43%.

Graph 1
WAC-Net Price Differential by Top Companies (2019)

Net revenues received by manufacturers were reduced by 13-64% company-wide, with an average of 43% in 2019

Graph 1
WAC-Net Price Differential by Top Products (2019)

While a great deal of attention is appropriately focused on the significant growth in manufacturer rebates, it’s important to bear in mind that supply chain intermediaries capture other significant revenue streams as a result of transaction fees, spread pricing and mark-ups. The US pharmaceutical industry is characterized by a complex and often opaque system of distribution and reimbursement, in which the business models of multiple intermediaries rely on revenue from fees and mark-ups in addition to after-the-fact rebates. Key players include wholesaler/distributors, pharmacies, PBMs, insurance companies and providers.

To provide a comprehensive overview of these revenues, we published an analysis in 2018 that estimated the revenues retained by each of these supply chain participants, which together amounted to approximately $480 bn. in 2016. While the drug manufacturers’ net revenues comprise 2/3 of these expenditures ($323 bn. in 2016), another 50% of that number is retained as gross profits by other stakeholders involved in the purchase, distribution and administration of drugs. See Graph 2 for the breakdown by sector.


2/3

~2/3 of annual drug spend goes to manufacturers, while other supply-chain participants and payers retain the remaining revenues

Graph 1
% of Revenues Retained by Pharma Sector Stakeholders (2016)

References
1.

Drug Channels (2021) Gross-to-Net Bubble Update: Net Prices Drop (Again) at Six Top Drugmakers. https://www.drugchannels.net/2021/04/gross-to-net-bubble-update-net-prices.html

Research & Insights

We conduct non-partisan, independent research, and make our work accessible and informative to policymakers and the general audience alike. Browse our featured research or explore our work by article type.

Impact of President's Budget and Point of Sale Rebate Proposal…
Milliman analyzes the impact of the proposed rule to implement point of sale rebates in Medicare Part D.
Drug Pricing Lab 03/08/2019
List Price, Net Price, and the Rebate Caught in the…
Pharmacy benefit managers (PBMs), such as Express Scripts, CVS Caremark, and Optum Rx, are some of the larger companies that administer the Medicare Part D prescription drug benefit.
JAMA Viewpoint 03/06/2019
Association of Rebates in Part D with Patient OOP and…
The way Medicare Part D's benefit design shows that rebates actually increase patients' out-of-pocket costs while shifting spending from plan sponsors and manufacturers to Medicare.
JAMA Internal Medicine 05/30/2017
Biosimilars in Medicare Part D: pricing dynamics and considerations
The Drug Pricing Lab engaged Milliman to prepare a report summarizing the pricing dynamics affecting utilization of biosimilars in the current Medicare Part D marketplace and under the proposed Part D benefit design in the Build Back Better Act.

This report was commissioned by the Drug Pricing Lab.
Milliman 12/14/2021
Ethics of Clinical Trials to Evaluate Biosimilars
Biosimilars require extensive, expensive, and time-consuming human testing prior to market entry, a process vastly different than generics. So why are we still doing them?
MedRx IV 03/09/2021
Who Is Sowing Seeds of Confusion About The QALY?
Industry sponsorship of patient advocacy groups opposing the QALY threatens to undermine not just the QALY but also an objective analysis of policy decisions.
Health Affairs 07/24/2020
Understanding the Rewards of Successful Drug Development: Thinking Inside the…
The ability to charge high prices is only one component of a complex system of risks and rewards that underlies pharmaceutical innovation.
NEJM 01/30/2020
Medicare Negotiation: A "Too Little" or "Too Late" Framework for…
Recent draft pieces of legislation and regulation take aim at the rising cost of drugs, targeting drugs that claim the largest share of the health care budget and that face limited competition from generics or biosimilars.
NEJM 11/28/2019
Fact Check: Time to Market for New Drugs in U.S.…
Drug prices in the U.S. are highest among developed countries, effectively setting the upper bound for reference prices elsewhere.
Drug Pricing Lab 10/11/2019
Mortgaging New Treatments Kicks the Can on High Drug Prices
The launch price for one-time gene therapy Zolgensma presents various implications.
Morning Consult 07/09/2019
DPL Responds to HHS RFI for IPI Drug Pricing Model…
Our response to the Trump administration’s Request for Information on implementing an international pricing index model for Medicare Part B drugs.
Drug Pricing Lab 12/31/2018
Spending On Prescription Drugs In The US: Where Does All…
Supply chain intermediaries, or “middlemen,” are being blamed for capturing much of the money that is often categorized as drug spending.
HA Blog 07/31/2018
Newsletter

Stay up to date on our work and news