Drug Pricing Tool

Launch Price Tracker

Rising Drug Costs in Cancer Care and Beyond

In 2009, Dr. Peter Bach published an influential Health Policy Report in the New England Journal of Medicine discussing the rising cost of cancer drugs in the United States.1 Since then, the list prices for newly approved cancer drugs and the total amount spent on these drugs has continued to climb. Between 2006 and 2017, drug spending per enrollee increased by 8.1% per year in Medicare Part B, compared to 3.4% per year in Medicare Part D and 2.9% per year for overall retail prescription spending.2 Overall drug pricing trends reflect exponential growth, leaving patients, payers, and the rest of the US healthcare system struggling to keep up.

The Drug Pricing Lab (DPL) tracks monthly prices of brand name oncology and non-oncology (antivirals, blood glucose regulators, immunological agents, and multiple sclerosis agents) drugs at the time of launch based on the year of FDA approval. Over the course of its lifetime, the oncology launch price tracker has been utilized as a tool to communicate and quantify the issue of rising costs to policy makers and researchers.3

Our full methodology can be found here.

What is at Stake ?
Unsustainable Growth

Drug price increases at an exponential rate are unsustainable for the US healthcare system. Note the logarithmic y-axis on the figures below.

The increasing cost of cancer drugs.

“It is not clear whether newer, more expensive drugs have produced a clinical benefit commensurate with their financial burden. As prices have increased, the financial cost necessary to achieve the same survival improvement using newer drugs has also increased.”4

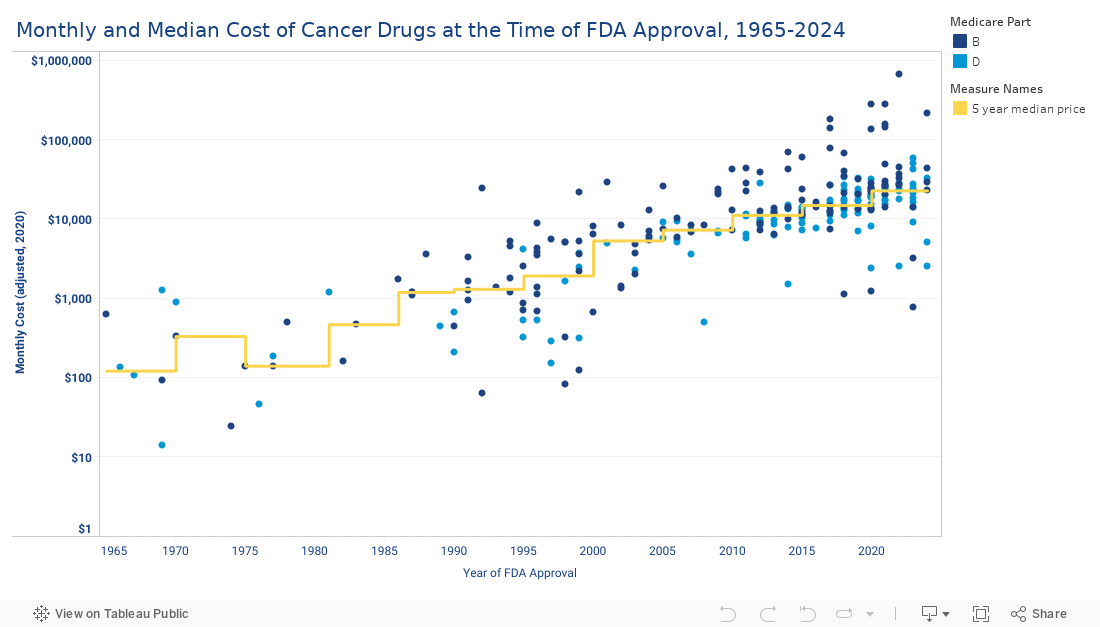
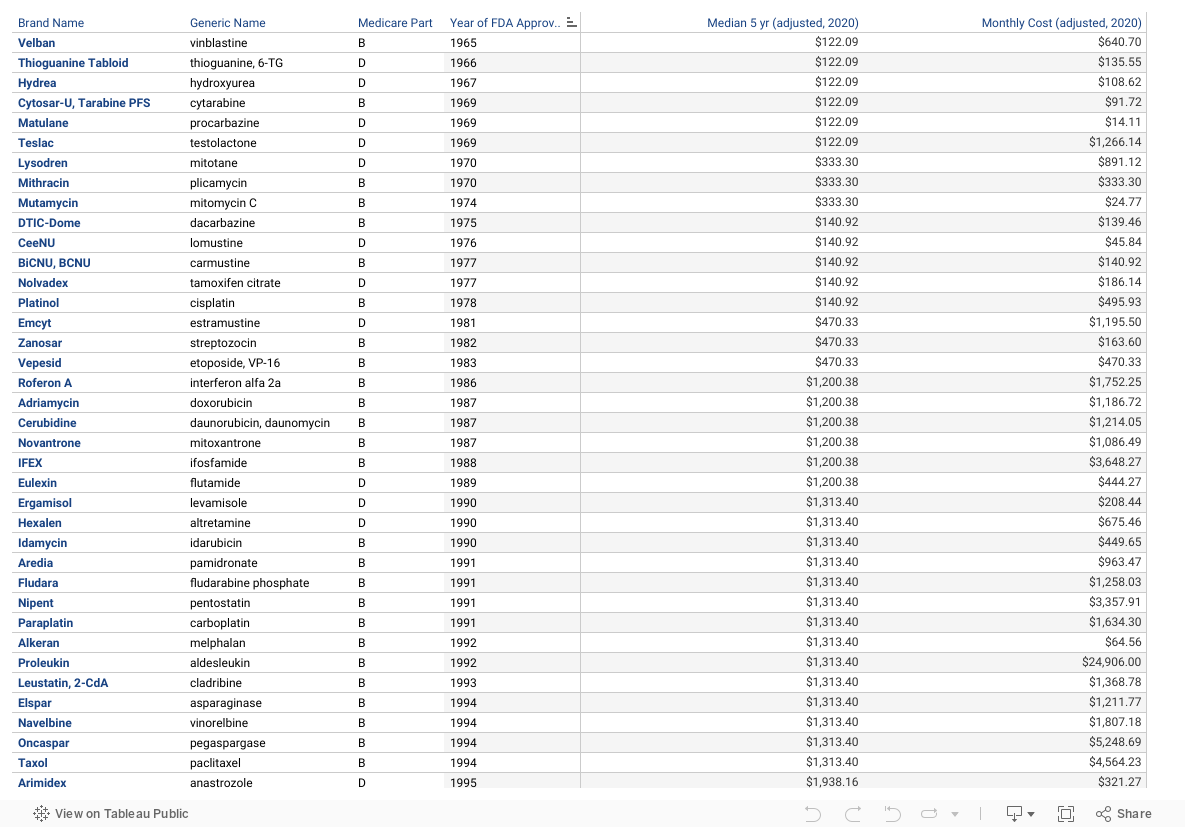
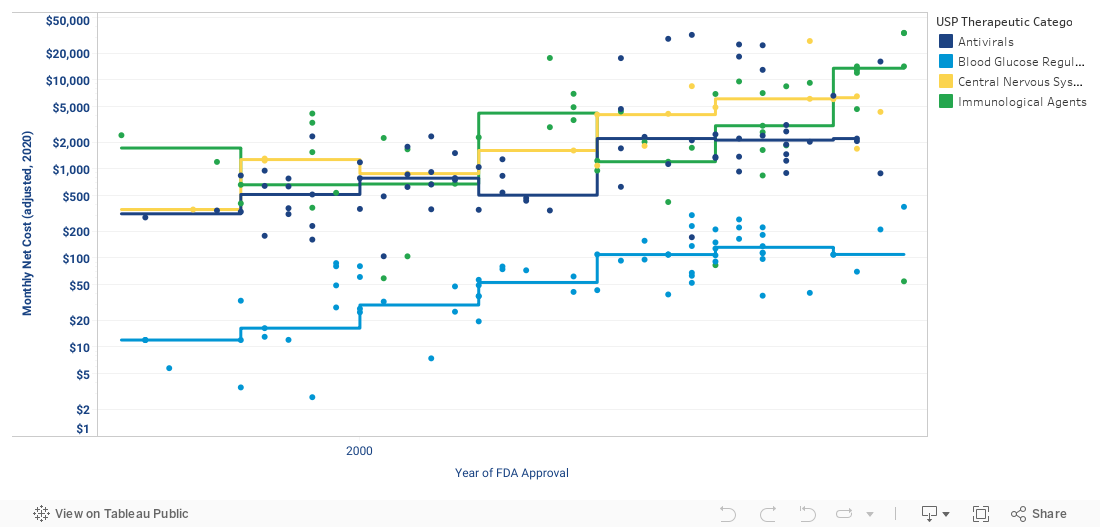
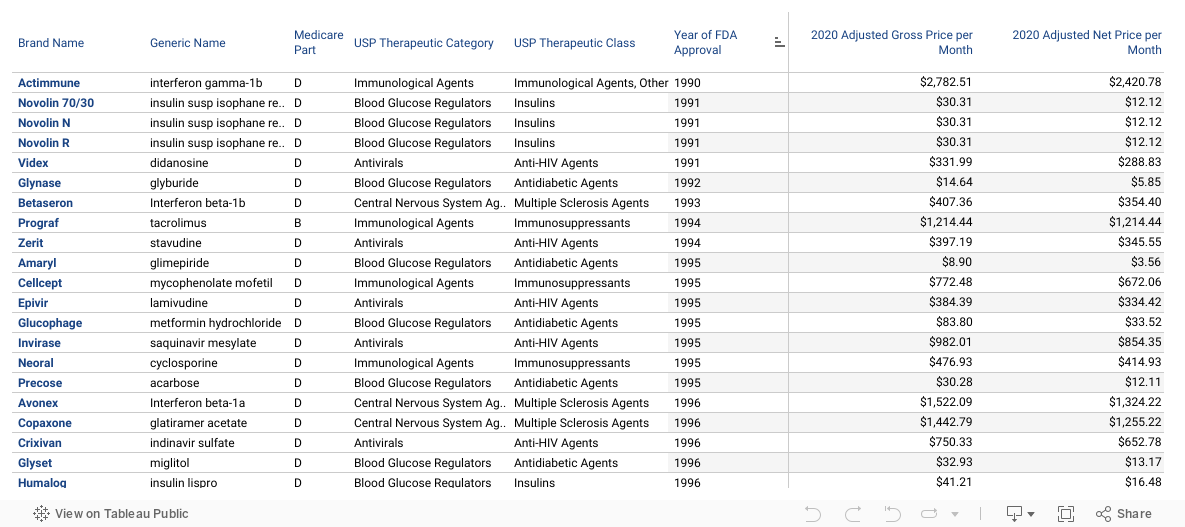
The median price of newly approved cancer drugs has increased 7-fold in 20 years. The unique policy environment in the US allows manufacturers to autonomously price drugs, with many benchmarked to comparable drugs in the market rather than its clinical benefit.5,6

Unlike other high-income countries, the US does not have any official governing body to monitor excessively priced drugs. Further, Medicare is prohibited from negotiating prices with drug manufacturers, and with oncology drugs as one of six protected drug classes, manufactures can set prices knowing that Medicare must cover all or nearly all oncology drugs.

Though the upfront costs of R&D have increased over time, the exponential increase to the cost of cancer drugs is far from reasonable. This increase is becoming unsustainable for the US healthcare system and for patient affordability. Graph 1 shows the monthly cost of cancer drugs at FDA approval from the time Medicare was signed into law in 1965 to 2020.

7X increase in median price over 20 years

The median price of newly approved cancer drugs has increased from $1,932 in 1995-1999 to $14,950 in 2015-2019.

132% increase in cancer drug approvals

While there were 44 drugs approved under cancer indications in the 1990s, 102 were approved in the 2010s.

Graph 1
Monthly and Median Costs of Cancer Drugs at the Time of FDA Approval, 1965-2023

The exponential increase in drug prices is not unique to cancer.

Rising drug prices are not unique to cancer – HIV medication, insulins, and other specialty drugs have increased over time to unattainable prices.7,8 Alongside the oncology tracker, DPL tracks the monthly costs of drugs in four USP-defined therapeutic categories: antivirals, blood glucose regulators, immunological agents, and central nervous system agents. The therapeutic categories of interest were chosen based on top Medicare spending and Wholesale Acquisition Cost sales in the US.

Antiviral drug prices have quadrupled

The median net monthly price of newly approved antiviral drugs has increased from $523 in 1995-1999 to $2,134 in 2015-2019.

While Medicare is not allowed to negotiate with drug companies, Part D plan sponsors can negotiate rebates and discounts with drug manufacturers. To account for the effect of rebates, especially among blood glucose regulators, Graph 2 shows the gross and net monthly prices of non-oncology drugs at the time of FDA approval. The non-oncology drug classes show prices that are also increasing at an alarming rate, supporting the 24% of patients who cite difficulty affording the cost of prescription drugs.9

The price of blood glucose regulators is now 8X higher

The median net monthly price of newly approved blood glucose regulators has increased from $16 in 1995-1999 to $133 in 2015-2019.

Graph 1
Gross Monthly and Median Prices of Non-Oncology Drugs at the Time of FDA Approval, 1990-2023

Graph 1
Net Monthly and Median Prices of Non-Oncology Drugs at the Time of FDA Approval, 1990-2023

"Financial toxicity compromises access to recommended therapies, reduces quality of life, and potentially shortens survival among patients with cancer."10

This rapid growth across indications has worrying implications for Medicare spending and overall national healthcare expenditure. Not only is exponential growth unsustainable, but higher prices for treatments has been shown to cause patient financial toxicity and poorer health outcomes.11,12,13 A significant proportion of Medicare drug spending comes from branded drugs with little to no generic competition. Prescription drug prices have long been a bipartisan issue and current policy makers have proposed a diverse range of solutions.15

Financial Toxicity

Problems a patient has related to the cost of medical care. Not having health insurance or having a lot of costs for medical care not covered by health insurance can cause financial problems and may lead to debt and bankruptcy, and also affect a patient’s quality of life and access to medical care.

Poorer Patient Outcomes

Patient out-of-pocket cost, often a function of a drug’s list price, is a main driver of drug non-adherence and leads to poorer patient outcomes.

References
1.

Bach P. Limits on Medicare’s Ability to Control Rising Spending on Cancer Drugs. NEJM. Feb 2009. https://www.nejm.org/doi/full/10.1056/nejmhpr0807774

2.

Nguyen X. Nguyen and Steve Sheingold. Medicare Part B Drugs: Trends in Spending and Utilization, 2006-2017. Office of the Assistant Secretary for Planning and Evaluation, U.S. Department of Health and Human Services. Nov 2020. https://aspe.hhs.gov/reports/medicare-part-b-drugs-trends-spending-utilization-2006-2017

3.

Hall S. The Cost of Living. New York Mag. Oct 2013. https://nymag.com/news/features/cancer-drugs-2013-10/

4.

Mitchell et al. Association Between Clinical Value and Financial Cost of Cancer Treatments: A Cross-Sectional Analysis. Journal of the National Comprehensive Cancer Network. Oct 2020. https://jnccn.org/view/journals/jnccn/18/10/article-p1349.xml?ArticleBodyColorStyles=Abstract%20%2F%20Extract

5.

Howard et al. Pricing in the Market for Anticancer Drugs. National Bureau of Economics Research. Jan 2015. http://Pricing in the Market for Anticancer Drugs

6.

Bach P. ‘Anchoring’ was at work in setting the price of Novartis’ new gene therapy. STAT News. Jun 2019. https://www.statnews.com/2019/06/04/anchoring-price-zolgensma/

7.

Congressional Budget Office. Prices for and Spending on Specialty Drugs in
Medicare Part D and Medicaid. 2019. https://www.cbo.gov/system/files/2019-03/54964-Specialty_Drugs.pdf

8.

NBC. States are trying to cap the price of insulin. Pharmaceutical companies are pushing back. Aug 2020. https://www.nbcnews.com/news/us-news/states-are-trying-cap-price-insulin-pharmaceutical-companies-are-pushing-n1236766

9.

Kamal and Colleagues. What are the recent and forecasted trends in prescription drug spending? KFF-Pearson. Feb 2019. https://www.healthsystemtracker.org/chart-collection/recent-forecasted-trends-prescription-drug-spending/#item-start

10.

Green et al. Review of Current Policy Strategies to Reduce US Cancer Drug Costs. Journal of Clinical Oncology. Feb 2020. https://ascopubs.org/doi/10.1200/JCO.19.01628

11.

Zafar et al. The financial toxicity of cancer treatment: a pilot study assessing out-of-pocket expenses and the insured cancer patient’s experience. The Oncologist. Feb 2013. https://pubmed.ncbi.nlm.nih.gov/23442307/

12.

Jay Furst. High cost of insulin has life-or-death implications for diabetic patients. Mayo Clinic. Jan 2020. https://newsnetwork.mayoclinic.org/discussion/high-cost-of-insulin-has-life-or-death-implications-for-diabetic-patients/

13.

NCI. Definition of Financial Toxicity. https://www.cancer.gov/publications/dictionaries/cancer-terms/def/financial-toxicity

14.

Cubanski J and Neuman T. Relatively Few Drugs Account for a Large Share of Medicare Prescription Drug Spending. KFF. https://www.kff.org/medicare/issue-brief/relatively-few-drugs-account-for-a-large-share-of-medicare-prescription-drug-spending/

15.

DPL Policy Tracker Tool. https://www.drugpricinglab.org/policy-tracker/

Research & Insights

We conduct non-partisan, independent research, and make our work accessible and informative to policymakers and the general audience alike. Browse our featured research or explore our work by article type.

Xeljanz, the FDA, and nine years of patient harm
Quantifying population-level adverse events in the near decade between when safety concerns were identified and FDA action
Drug Pricing Lab 05/31/2022
Atypical antipsychotics: Decades of use, unfathomable harms
Using attributable risk calculations to quantify how many premature deaths resulted from atypical antipsychotic use in the elderly
Drug Pricing Lab 05/31/2022
Medicare Part B Premium Dynamics Explained
The Drug Pricing Lab commissioned Milliman to prepare a report exploring the impact of changes in Medicare Part B program costs on beneficiaries’ premiums and Social Security payments. This report focuses on the 2022 Part B premium for beneficiaries with various income levels to illustrate the payment dynamics and discusses the implications for related programs.
Milliman 12/23/2021
Comparing Factors that Influence Pharmaceutical Pricing and Access in the…
Drug prices in the United States are some of the highest in the world, which has triggered several policy proposals aimed at adopting pricing strategies used by other countries.
Drug Pricing Lab 12/20/2021
Biosimilars in Medicare Part D: pricing dynamics and considerations
The Drug Pricing Lab engaged Milliman to prepare a report summarizing the pricing dynamics affecting utilization of biosimilars in the current Medicare Part D marketplace and under the proposed Part D benefit design in the Build Back Better Act.

This report was commissioned by the Drug Pricing Lab.
Milliman 12/14/2021
Evaluating Industry’s Drug Pricing Claims
A closer look at three of PhRMA’s most cited talking points.
Drug Pricing Lab 11/18/2021
Mapping conflict of interests: scoping review
A scoping review of the literature to identify all known ties between the medical product industry and the parties and activities in the healthcare ecosystem.
Drug Pricing Lab 11/03/2021
Production Plus Profit Pricing (P-quad) FAQ
08/17/2021
What A Waste! The National Academy Of Medicine’s Report On…
Why Congress should not follow the National Academy of Science, Engineering, and Medicine’s recommendation to remove the JW modifier.
Health Affairs Blog 07/09/2021
Medicare Must Study Unproven, Expensive Alzheimer’s Drug
Medicare cannot indiscriminately cover the cost of Aduhelm for the treatment of Alzheimer's disease without first evaluating whether it truly works.
Bloomberg Opinion 06/15/2021
Value-Based Management of Specialty Drugs: Practical Considerations and Implications for…
Not all approaches are suited to meeting policy makers and health plans’ goals of managing specialty drugs based on their value. Researchers conducted a qualitative study with Blue Cross Blue Shield plans interested in implementing value-based specialty pharmacy management to observe the plans’ objectives, strategies, and factors influencing their ability to execute on these strategies.
AJMC 05/13/2021
Trump's Drug-Pricing Ideas Would Cost Taxpayers a Bundle
Meanwhile, pharmaceutical companies would stand to make a lot more money.
Bloomberg Opinion 09/29/2020
Newsletter

Stay up to date on our work and news